Reports
Download PDF
The table with completed reports can be displayed by clicking the Reports button in the top navigation menu. The number displayed to the right of the Reports button indicates the count of unread reports.
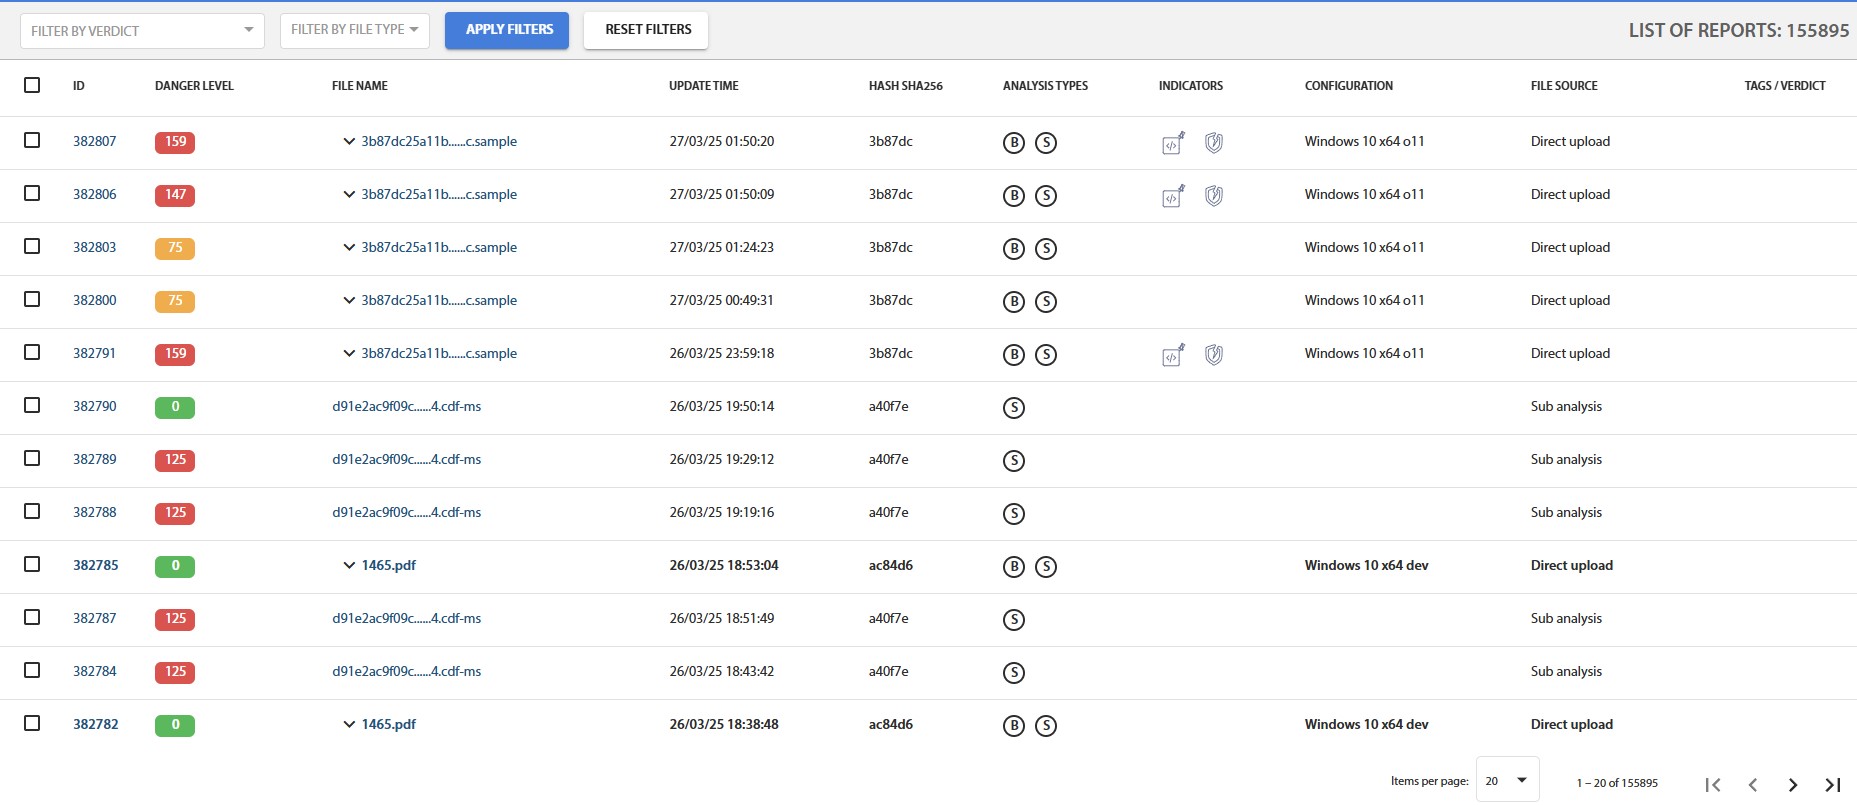
Fig. 9 – List of Generated Reports
The table contains the following columns:
Checkbox for selecting multiple reports to perform operations on a group of objects;
- Report read status;
- Analysis type (a set of icons) – dynamic, static;
D ⏳
- Dynamic analysis execution statusD
- Dynamic analysis completedS
- Static analysis completed.
- Report generation date and time;
- File name – a link to the report and the name under which the file was uploaded;
- SHA256 hash value of the file, which can be used for quick search of identical files.;
- File activity indicators (a set of icons), such as internet activity, process injection, service creation, autostart execution (a list of possible indicators is provided in Appendix 1);
- Number of screenshots taken during dynamic analysis.
- Threat level calculated by the tLab system based on the volume and maliciousness of activities detected during dynamic analysis. The higher the value, the more dangerous the file;
- Danger indicator shows the file's risk level on a color scale: green – safe, orange – requires attention, red – high likelihood of maliciousness;
- Expert or administrator conclusion. The conclusion is provided within the report.
Clicking the Filters button displays an additional menu where you can sort the list of reports by various properties or select the number of results displayed per page. The Select All button highlights all reports on the page, allowing actions to be performed on them: Mark as Read/Unread or Delete. Deleted files are moved to the trash, which is accessible only to the administrator. Accidentally deleted files can be restored from the trash.
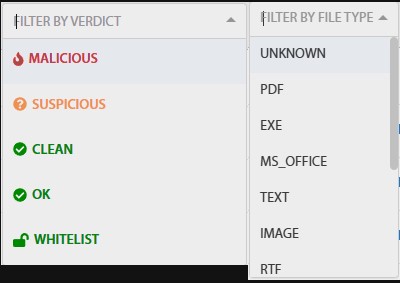
Fig. 10 – Filter Menu
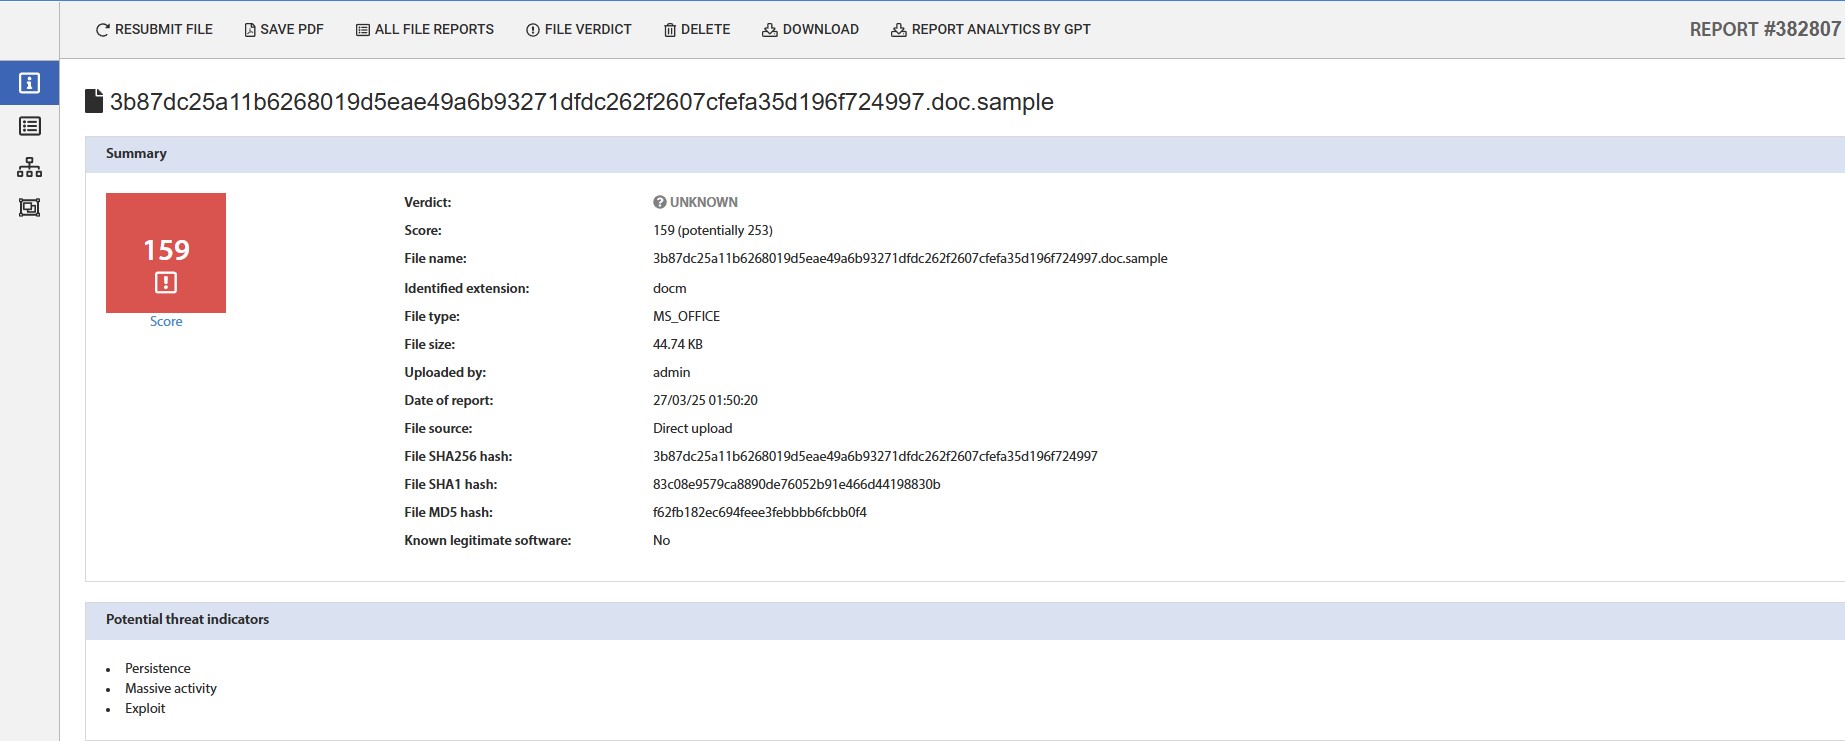
Fig. 11 – General Report
The report page consists of three vertical tabs. The General Report tab contains general information about the file, the expert's conclusion, and analysis parameters. The Static Report tab includes data collected by the static analyzer. The Dynamic Report tab presents the results of the dynamic analysis. Clicking the File Operations button displays the corresponding menu:
- Resend (opens the form for resubmitting the file for analysis);
- History (a list of all reports for this file with date-links to the reports);

Fig. 12 – File Operations Menu
Clicking the Search button in the navigation menu opens the report search page in the system. The search is conducted across multiple fields, which can be found in the general report and are also displayed in the corresponding columns of the report list and queue. When entering 4 to 6 characters in the SHA256 search field, a dropdown list appears showing reports that contain matching characters. To access the found report, the full hash value must be entered (or selected from the list) and the Search button pressed.
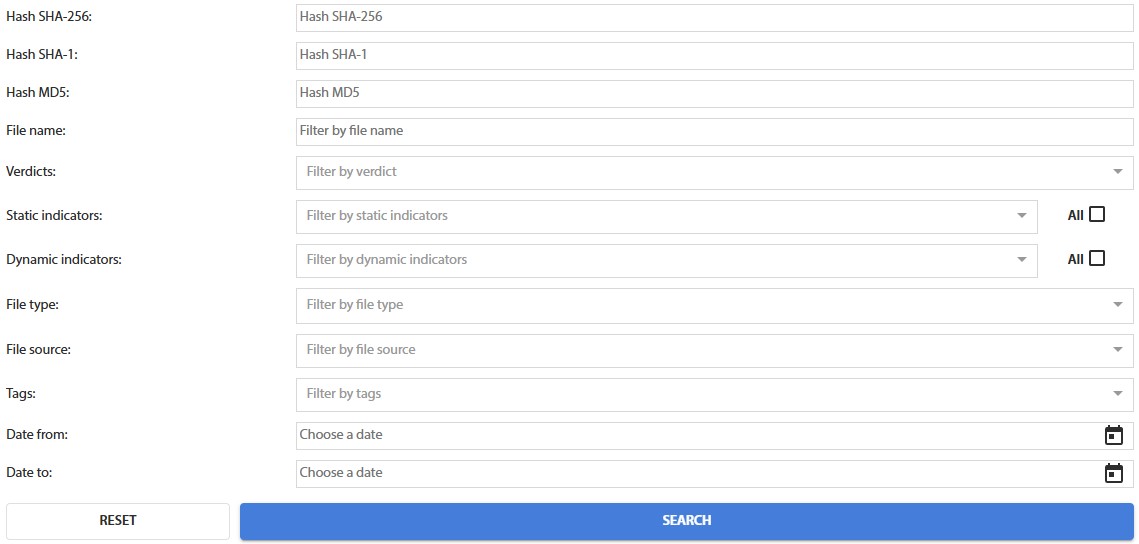
Fig. 13 – Report Search Page